On July 2, 2026, the FBI, working with Google, Lumen, and Shadowserver, seized hundreds of domains behind NetNut, one of the largest residential proxy providers in the world. The seizure followed KrebsOnSecurity's reporting linking the network to the Popa botnet: at least two million compromised devices, including smart TVs and streaming boxes enrolled as proxy exit nodes without their owners' consent.
For us, NetNut was never just a headline. Layer3 Intel's enumeration pipeline was routing roughly 2 million requests per hour through the network and watching ~1.2 million unique exit IPs come out of it every hour. Over the last four months we attributed 63.7 million distinct IPv4 addresses to NetNut, 32.96 million of them observed in the 30 days before the network went fully dark on July 4.
Takedowns of this size are rare, and they create a natural experiment: when a major proxy network disappears, does its underlying inventory of residential devices disappear with it, or does the same inventory stay reachable through everyone else? Layer3 Intel observes exit nodes across every major residential proxy network (over 500 million unique signals a day), so we could measure the answer directly.
Watching a proxy network go dark
The collapse was staged, not a kill switch. NetNut looked completely healthy through 15:00 UTC on July 2, posting 1.27 million unique IPs that hour, about 2% below its peak for the entire period. Then, within hours of the seizure announcement, the network began to drain: below 50% of baseline by 08:00 UTC on July 3, below 10% by midnight, below 1% by 09:00 UTC on July 4. The biggest single-hour loss came mid-afternoon on July 3, when the network shed 229,000 IPs between 14:00 and 15:00 UTC. But the most telling step came at the very end: between 05:00 and 06:00 UTC on July 4, hourly counts fell from 78,479 to 19,345. A 75% cut in one hour, at the bottom of a three-day drain, looks like a central service or a major supplier finally being switched off.
The drawn-out profile, roughly 60 hours from first decline to darkness, suggests staged supplier disconnection, credential revocation, and session draining rather than one global off switch. It also looks nothing like an ordinary outage. NetNut had bad days in June, the worst of them cut capacity roughly in half overnight, a dip we observed around the same time as Spur's investigation into how NetNut co-opts entire partner networks for exit capacity. Every one of those June dips was back at baseline within hours. This time nothing came back. By July 5 hourly unique-IP volume fell 99.92%.
NetNut exit nodes observed per hour
Unique residential IPv4 addresses, June 1 – July 5, 2026 (UTC)
Did 33 million IPs actually disappear?
To find out, we took every IP observed on NetNut in the 30 days before July 4, the point at which the shutdown was essentially complete, and checked whether it reappeared on any other proxy network in the 14 days after. The headline number: 16.90 million of those IPs, 51.27%, were re-observed elsewhere.
That raw figure is misleading in both directions. Residential IPs churn constantly: devices go offline, DHCP leases rotate, carrier-grade NAT reshuffles address pools. An IP last seen on NetNut three weeks before the shutdown was already unlikely to resurface anywhere, takedown or not. So we bucketed the cohort by how recently each IP was last seen on NetNut, and ran the identical analysis against a June 4 placebo cutoff.
| IP age at cutoff | June baseline | Post-takedown | Change |
|---|---|---|---|
| 1–2 days | 86.29% | 78.81% | −7.48 pts |
| 3–6 days | 62.63% | 60.38% | −2.25 pts |
| 7–13 days | 49.28% | 46.49% | −2.79 pts |
| 14–30 days | 37.06% | 35.22% | −1.84 pts |
Two things jump out. First, the placebo curve looks almost identical to the takedown curve, which means most of the apparent "disappearance" in the raw 51.27% figure is just normal residential churn. Second, every post-takedown bucket underperformed its historical baseline, and the gap is largest exactly where it should be if the takedown had a real effect: among the freshest IPs. Reappearance for IPs seen on NetNut within 48 hours of shutdown fell from 86.29% to 78.81%. Put differently, the share of fresh IPs that failed to resurface grew from 13.71% to 21.19%, a roughly 55% relative increase.
What the takedown actually removed
Applying the June baseline rates to the July cohort, we would have expected roughly 17.96 million of NetNut's recent IPs to be re-observed on other networks. We observed 16.90 million. So the takedown removed an estimated 1.06 million IPs from the residential proxy ecosystem beyond what churn alone would explain, about 465,000 of them from the freshest cohort. A real effect, but a small one: a single-digit percentage of the network's recent footprint.
The other ~79% of NetNut's freshest inventory stayed reachable through competing networks. That matches what we see across the industry: suppliers sell to multiple networks, inventory gets resold, and plenty of devices carry more than one proxy SDK. Individual competing networks each re-observed millions of recent NetNut IPs, the largest single concentration running past 9 million addresses.
The network that didn't get taken down
From here on, this stops being a story about NetNut. The single largest concentration of "taken down" inventory sits with Bright Data, the biggest residential proxy provider in the world and the one that built its entire brand on being the ethical one: KYC-verified customers, opt-in consent from device owners, compliance officers, transparency reports, the works. Comparing NetNut's 30-day cohort against Bright Data's observed pool, 39.04% of NetNut's IPs, 12.87 million addresses, appeared in both networks over the same window. Restrict Bright Data's side to the 14 days after the shutdown and 9.18 million of those addresses, 27.85% of everything NetNut had live in its final month, were still reachable through Bright Data alone. More than one in four addresses from a network seized over a botnet remained accessible through the industry's self-described clean player.
Flip the comparison around and it gets worse. Over the same window, roughly a third of Bright Data's own observed exit pool was simultaneously reachable through NetNut, a single competitor. That overlap alone caps the proprietary, consent-based inventory Bright Data's brand is built on at two-thirds of its network. Measure it directly, against every other network we track with NetNut excluded entirely, and the ceiling drops to two-fifths: 59% of Bright Data's observed exits, 22.8 million of 38.5 million addresses, appeared on at least one competitor — the same resold device inventory that flows through the wider proxy ecosystem, which until July 2 included a network fed by two million hijacked smart TVs. The shared majority has no consent story at all: consent does not survive resale through an upstream supplier you don't control. Either Bright Data audits the provenance of its network and somehow missed 22.8 million shared addresses, or the KYC-and-consent story is marketing that stops at the edge of its proprietary pool.
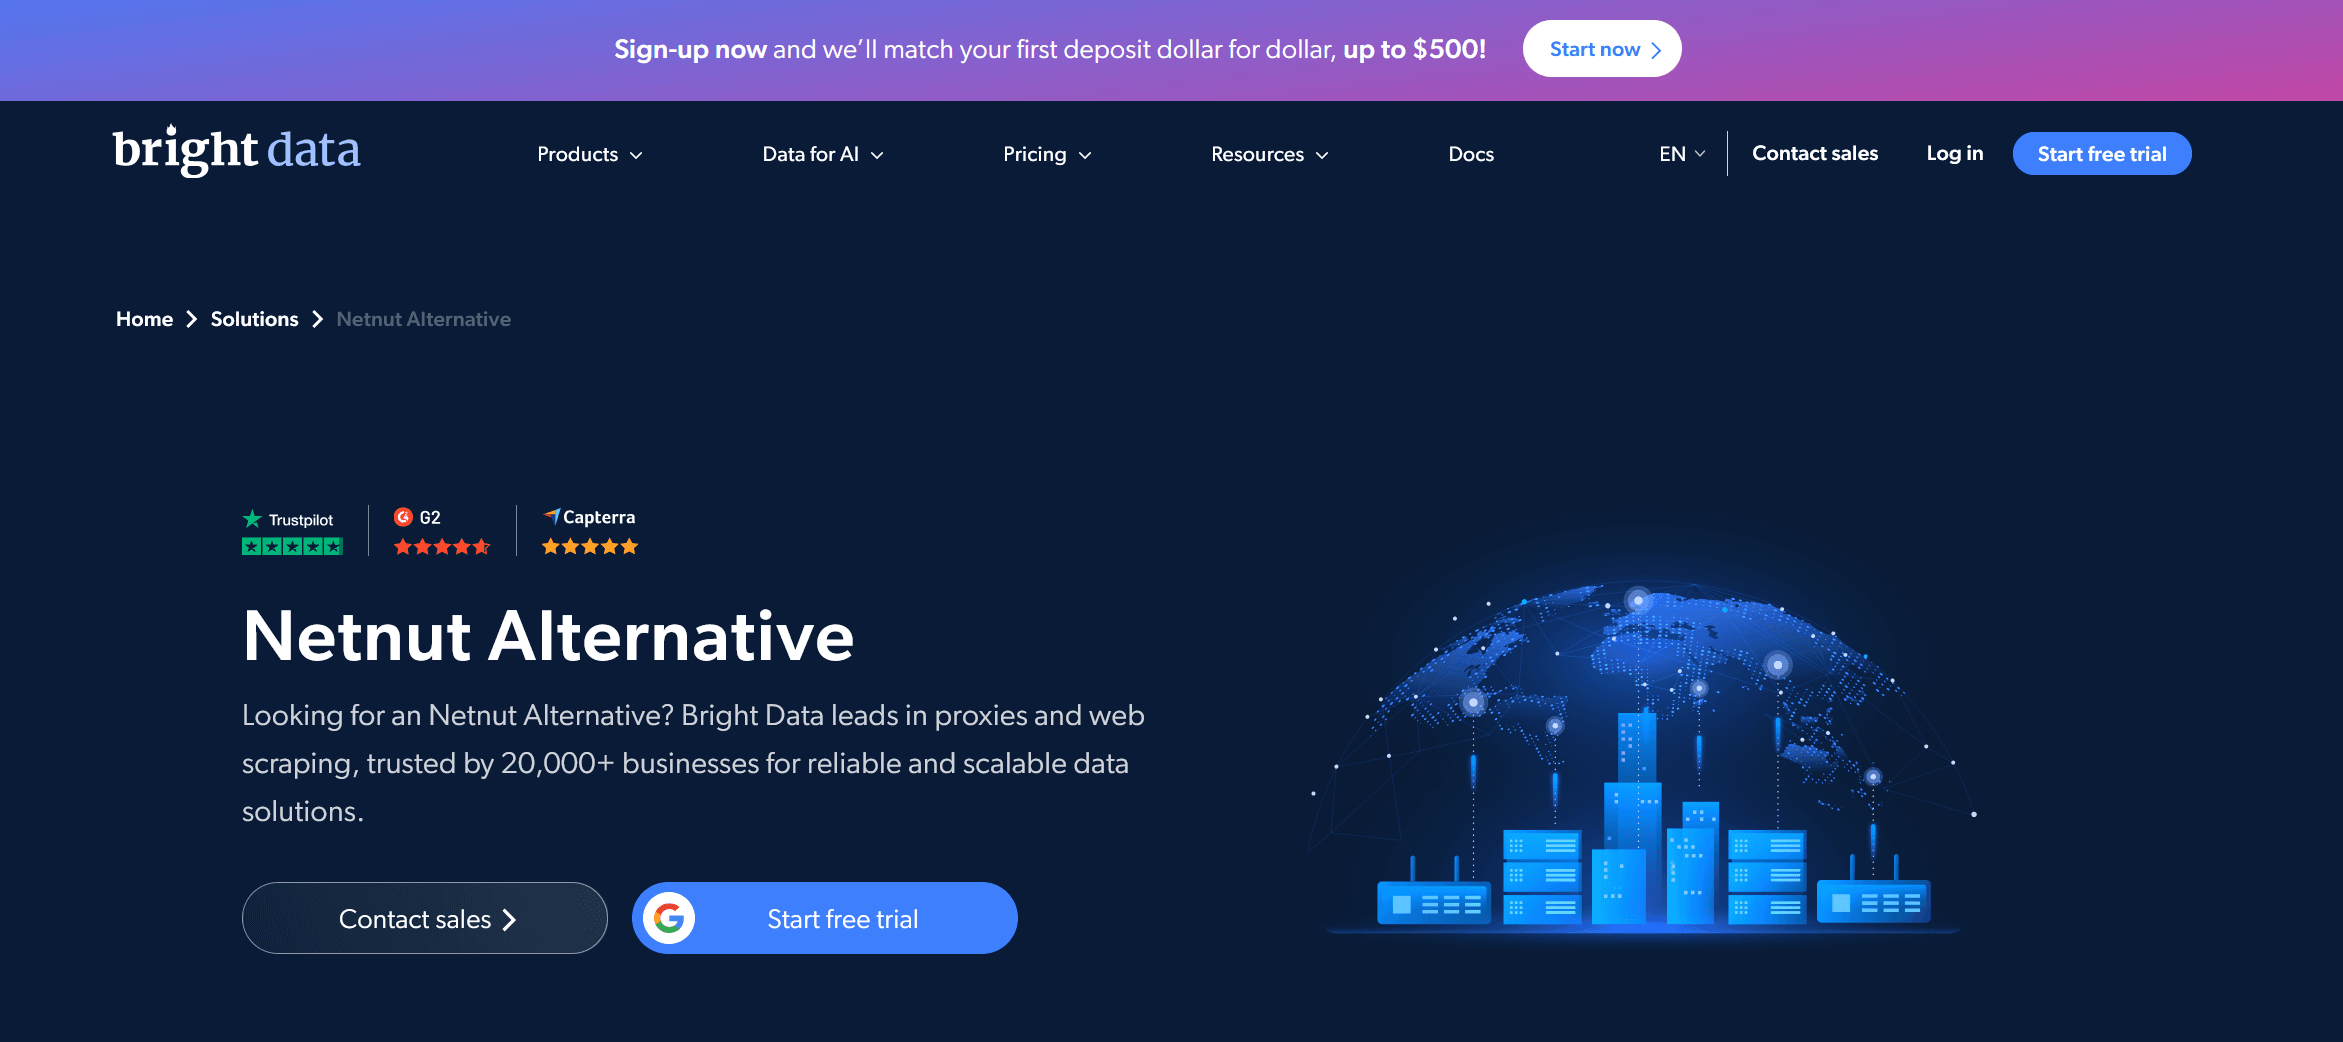
Bright Data, for its part, spent the takedown doing what any competitor would: running a "NetNut Alternative" landing page to absorb the seized network's customers. Those customers, per our numbers, will find a lot of familiar exit IPs waiting for them.
Bright Data's "NetNut Alternative" landing page
Live as of July 18, 2026
Google picks the targets
The NetNut seizure was not a one-off, and Google was not a passive "industry partner." Google Threat Intelligence Group published its own announcement of the NetNut disruption on July 2, the day of the seizure, describing how it disabled Google accounts used for command and control and pushed Play Protect removals of apps carrying NetNut SDKs. In January, Google announced the takedown of IPidea and twelve of its sub-brands, billing it as the largest residential proxy network in the world. That title actually belongs to Bright Data, though IPidea was significant. Two takedowns in six months, both led or co-led by Google, both framed the same way:
"While some providers may indeed behave ethically and only enroll devices with the clear consent of consumers, any claims of 'ethical sourcing' must be backed by transparent, auditable proof of user consent."
— Google Threat Intelligence Group, January 2026
Take that standard seriously for a moment. A provider whose observed exit pool shares 12.87 million addresses with a network seized over non-consensual device enrollment does not have transparent, auditable proof of user consent for those addresses. Nobody in this industry does; the overlap numbers above are what the supply chain actually looks like. If Google's stated standard were the operative one, Bright Data's shared inventory would make it a target. It isn't one. Something other than consent decides who gets seized, and the next two sections of this post are about what.
Meanwhile, Google started challenging known proxy IPs
While the takedowns made headlines, a quieter change shipped with no announcement at all. In recent weeks, Google Search has begun serving reCAPTCHA challenges to known residential proxy IPs, addresses it has identified as proxy exits, when they show up on a fresh browser profile with no cookies or history. Google is not challenging residential addresses in general: it has built its own map of the residential proxy pool, and it challenges exactly the addresses on it. That matters because residential IPs were the entire reason scrapers moved off datacenter ranges — Google couldn't separate them from real customers, so it left them alone. That cover is gone. Datacenter ranges were already walled off, and now a known proxy exit on a fresh session draws a challenge too. Scraping Google hasn't become impossible, but it has become much harder and more expensive: sessions from flagged exits now start with a puzzle instead of a results page.
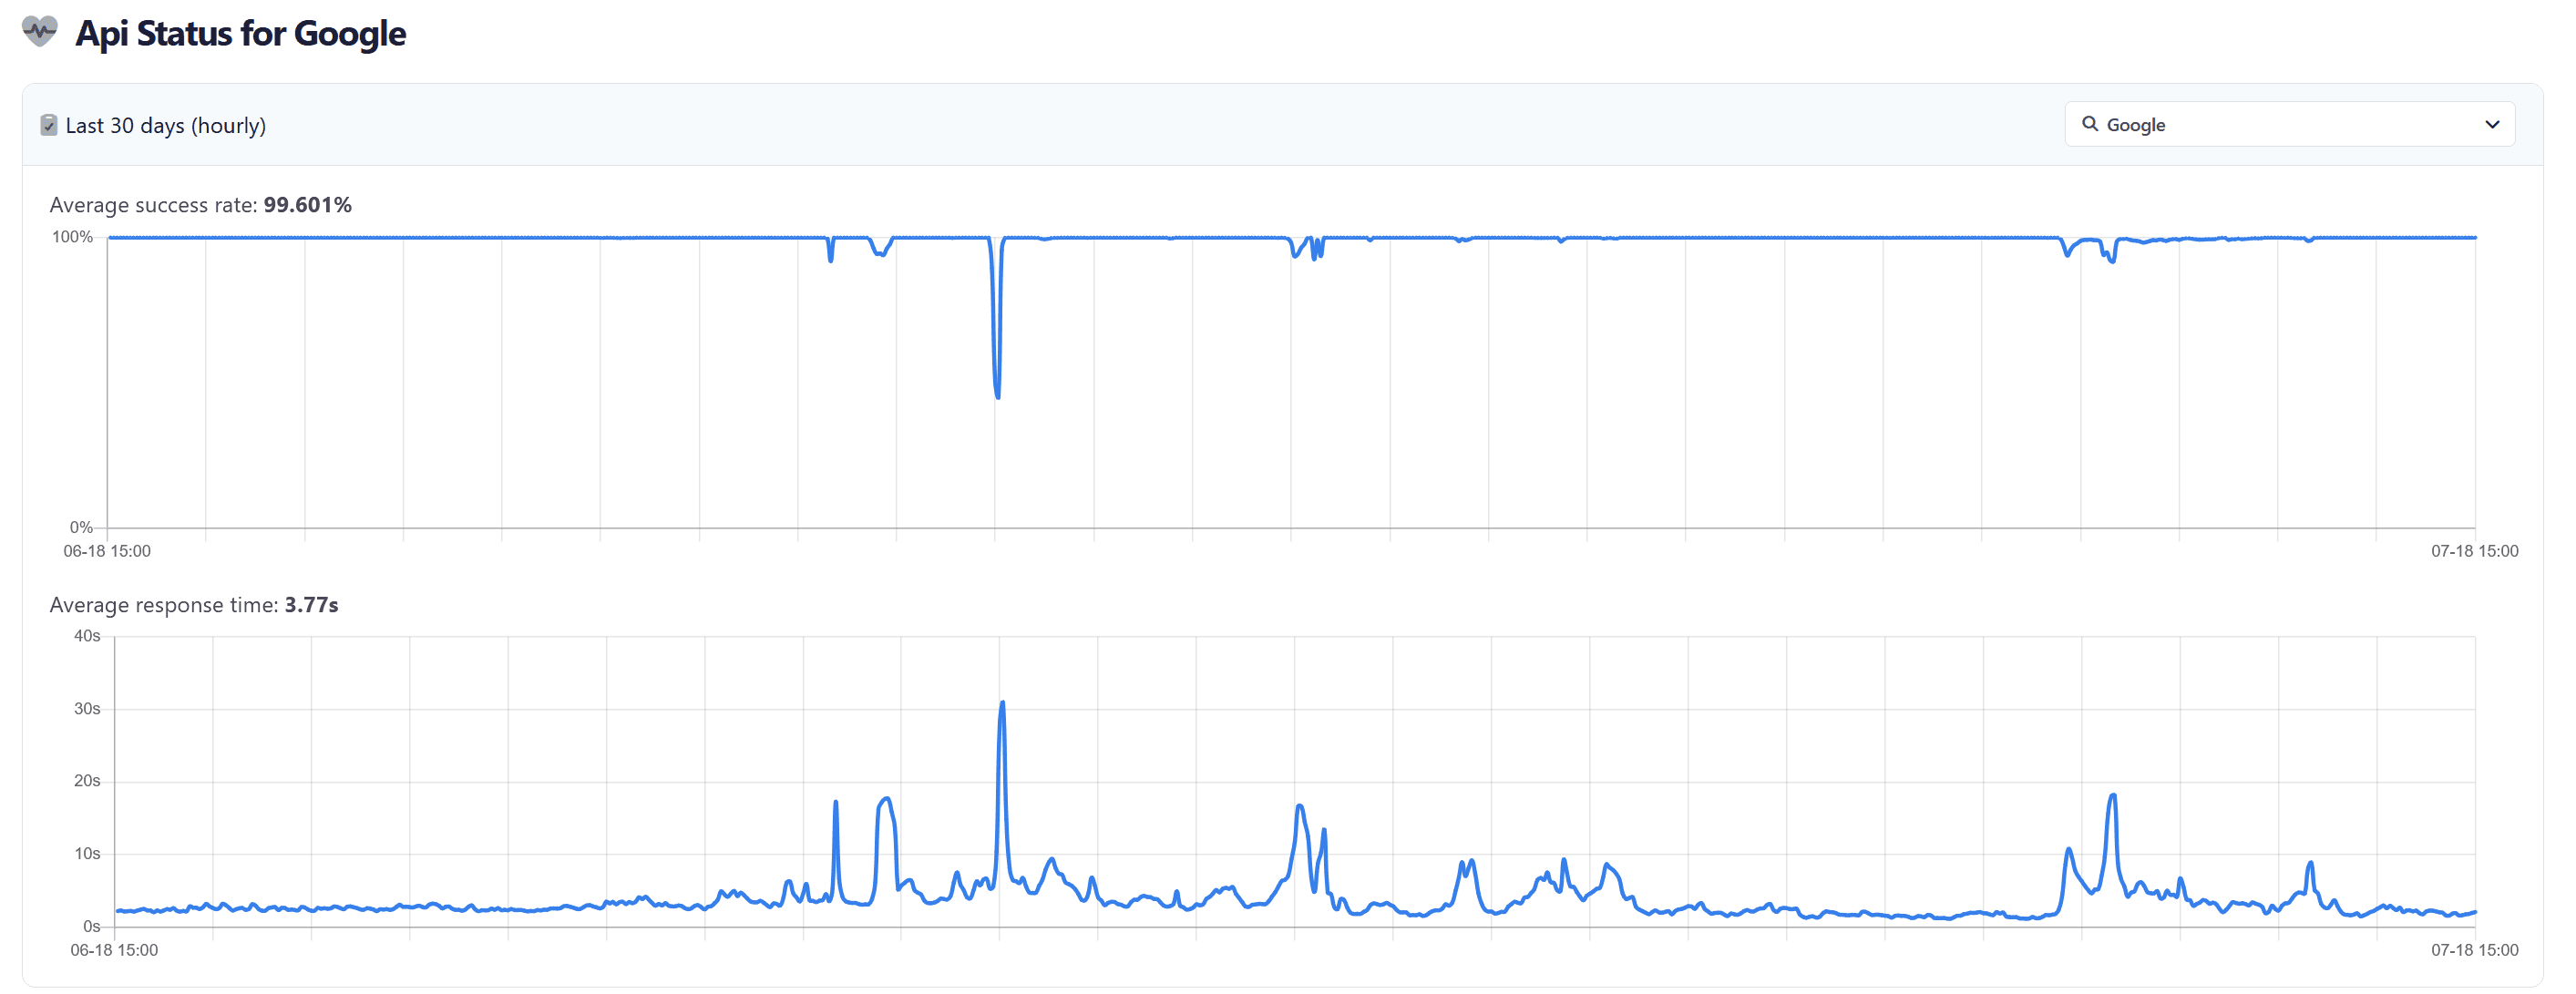
You can watch this happening in public data. SerpApi, a business built on scraping Google search results at scale through exactly these proxy networks, publishes a live status page for its Google endpoint. Over the last 30 days its average response time is 3.77 seconds, and hourly averages that used to sit near 2 seconds now repeatedly spike into the 10–30 second range. That's what challenge-solving overhead looks like once it gets averaged into a request pipeline: spike clusters consistent with waves of known proxy exits getting stopped at the door and either solving or rotating their way through.
SerpApi — API status for Google
Last 30 days, hourly (June 18 – July 18, 2026)
And Bright Data stopped routing to google.com
One more observation ties all of this together, and this one anyone can reproduce. Send a request to google.com through Bright Data's residential pool and look at the challenge page Google returns: the IP address it flags as malicious is a datacenter address, not a residential one. Bright Data no longer routes its residential exit nodes to Google. Traffic bound for google.com gets shunted onto datacenter ranges, the kind of addresses Google blocks on sight, while the residential pool stays pointed anywhere but Google's front door. The biggest proxy network on earth, the one Google has so far declined to touch, has quietly stopped aiming its residential network at Google.
Put the events in order. Google takes down IPidea, one of the biggest residential proxy networks in the world. Six months later it takes down NetNut, another of the biggest. It starts challenging known residential proxy IPs on its search front end, the shared infrastructure every scraper of Google results depends on. And the biggest network of them all, the one Google leaves standing, with tens of millions of the same shared IPs in its pool, stops routing residential traffic to google.com at the same time. Google is saying don't scrape our search results or else, and Bright Data is behaving exactly like a company that got the message.
This should alarm you regardless of what you think about proxy networks. Google built its empire by crawling everyone else's website without asking. Residential proxy infrastructure is, for better or worse, the only way anyone else can do to Google what Google did to the web: crawl it without asking and build a competing index.
What the takedown was actually for
Seizing a network that gave access to 33 million monthly IPs removed about one million addresses from circulation: a single-digit percentage of NetNut's own recent footprint, and a rounding error against the 70-plus million residential proxy IPs we observe live across the wider ecosystem at any given time. The devices are still online, still carrying proxy SDKs, still for rent through every other major network. As an attempt to shrink the residential proxy supply, the largest takedown in the industry's history did not work, and nothing in the churn math suggests the next one will.
As leverage, it worked exactly as intended. Google's stated standard, transparent and auditable proof of consent, would indict the entire supply chain documented above, starting with the largest network in the industry. Its revealed standard is simpler. The networks that got seized were the doors people used to reach Google's search results, and the network left standing closed that door itself. Consent decides the press release. Where your exit nodes point decides the target list.